Hourly to Salary Chart
Look up any hourly rate from 10 to 100 to see the daily, weekly, biweekly, monthly and yearly pay at your hours per week.
Recent
Your last 10 settings, saved only in this browser. Nothing is uploaded.
How to use the Hourly to Salary Chart
- Type your hourly rate in the “Look up an hourly rate” box. It starts at 25. The annual pay appears as the main result and updates as you type.
- Set the hours per week. It starts at 40 and can go up to 168. For part-time work, enter a lower number such as 30, or use the preset buttons above the form.
- Set the weeks per year. It starts at 52 and can be from 1 to 53.
- If you need the U.S. federal basis, open “More options” and choose the hours-per-year basis “U.S. federal pay (OPM)”. This uses a fixed 2,087 hours a year.
- Check the result, then open “How it was calculated” under it to see each step with your values.
- Scroll to the charts to compare rows. The chart titles show the hours per year used.
Under the result, “Copy result” copies the result lines with a link, and “Copy link” copies the page address that holds your inputs. “Print / save as PDF” creates a one-page record, and “Reset” restores the starting example.
To compare other hours, change hours per week and every row of both charts recalculates. The OPM option switches the year to a fixed 2,087 hours.
How is $25 an hour turned into a yearly salary?
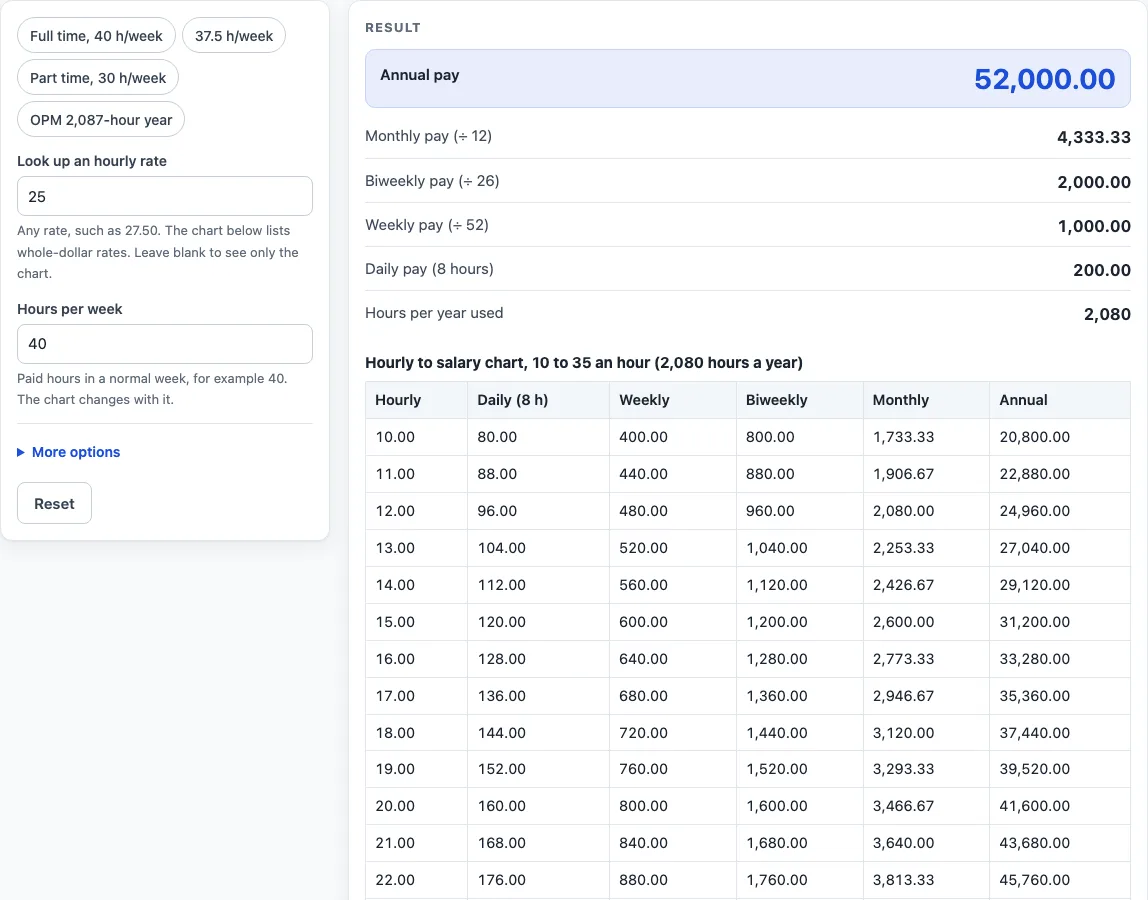
Multiply the hourly rate by the number of paid hours in a year. The hours per year come from hours per week multiplied by weeks per year. At 40 hours a week for 52 weeks, that is 40 × 52 = 2,080 hours, so $25 × 2,080 = $52,000 a year.
The other columns follow from the annual figure. Monthly pay is annual ÷ 12, which gives 4,333.33. Biweekly pay is annual ÷ 26, which gives 2,000.00. Weekly pay is annual ÷ 52, which gives 1,000.00. Daily pay is the rate × 8, which gives 200.00.
Changing the hours per week changes every row. At 30 hours a week, 30 hours × 52 weeks = 1,560 hours, so $30 an hour gives $46,800 a year, or $3,900.00 a month.
The OPM basis uses a fixed 2,087-hour year, as described in the U.S. Office of Personnel Management fact sheet “Computing Hourly Rates of Pay Using the 2,087-Hour Divisor.” For example, $45.50 × 2,087 = $94,958.50 a year. Hours per week, weeks per year and unpaid weeks are not used on this basis, and the page shows a warning if they differ from 40, 52 and 0.
How do I look up one rate?
Type any hourly rate in the look-up box above the charts to get its annual, monthly, biweekly, weekly and daily pay, with the annual figure as the main result. Leave the box empty to see only the charts. Set the hours per week and weeks per year to match your job, or pick the OPM basis. The two charts show every whole rate from 10 to 60 and every fifth rate from 65 to 100, each with six columns: hourly, daily (8 hours), weekly, biweekly, monthly and annual.
What is 16 an hour a year, and what is 30?
At 40 hours a week for 52 weeks, 16 × 2,080 = 33,280 a year, or 2,773.33 a month. At the same hours, 30 an hour is 30 × 2,080 = 62,400 a year, or 5,200.00 a month. At 30 hours a week, the same 30 an hour gives 46,800 a year. These are gross figures before tax or other deductions. The chart works in any currency, because only the number is used.
Worked examples
| Input | Result |
|---|---|
| 25 an hour, 40 h/week, Standard (hours per week × weeks) | 52,000.00 a year (4,333.33 a month) |
| 20 an hour, 40 h/week, Standard (hours per week × weeks) | 41,600.00 a year (3,466.67 a month) |
| 30 an hour, 30 h/week, Standard (hours per week × weeks) | 46,800.00 a year (3,900.00 a month) |
| 45.5 an hour, 40 h/week, U.S. federal pay (OPM): 2,087 hours a year | 94,958.50 a year (7,913.21 a month) |
Calculated by the tool above; open it with the same values to see each step.
Frequently asked questions
Does $25 an hour equal $52,000 a year?
Yes, at 40 hours a week for 52 weeks, 25 × 2,080 = 52,000. If you work fewer or more hours, the annual figure changes in proportion.
What is 16 an hour a year?
At 40 hours a week for 52 weeks, 16 × 2,080 = 33,280 a year, or 2,773.33 a month.
What is $30 an hour at 40 hours a week?
30 × 2,080 = 62,400 a year, or 5,200.00 a month. At 30 hours a week, the same rate gives 46,800 a year.
Why might my real pay differ from the annual figure?
The figure assumes every scheduled hour is paid at the same rate with no changes. Actual pay can differ if your hours vary, if overtime applies, or if deductions are taken from your pay.
Can I look up a rate that is not on the charts?
Yes. The look-up box accepts any rate, including decimals such as 27.50. The chart covers whole rates only.
What errors does the calculator show?
It shows an error for a rate that is not a number, is zero or is negative. It also shows one for hours per week that are empty, zero or above 168.
Is the hourly to salary chart free, and is anything I type uploaded?
Yes, it is free and needs no account or sign-up. Everything is calculated in your browser, and nothing you type is uploaded.
Is this tax or payroll advice?
No. Results are plain arithmetic on the numbers you enter, before any deduction. They are not legal, tax or payroll advice, and rules differ by country, state and contract.
Related tools
- Salary to Hourly Calculator: turn a salary into an hourly rate.
- Hourly to Salary Calculator: turn an hourly rate into a yearly salary.
- Monthly Salary to Hourly Calculator: turn a monthly salary into an hourly rate.
- Salary to Hourly Chart: a chart of hourly pay for yearly salaries from 20,000 to 250,000.
- Hourly Wage Calculator: gross pay per day, week, month and year from an hourly rate.
- Biweekly Pay Calculator: compare gross pay per paycheck for weekly, biweekly, semi-monthly and monthly pay.
- PTO Accrual Calculator: paid time off earned per pay period or per hour worked.